
To set up Prometheus and Grafana on your VPS for pro-level monitoring, start by installing Prometheus and configuring custom alert rules for your environment’s metrics. Next, deploy Grafana and connect it to Prometheus as a data source. Customize dashboards to visualize key metrics and incorporate alert notifications through channels like Slack or email. With proper setup, you’ll get real-time insights and alerts. Keep exploring to learn how to optimize your monitoring system further.
Key Takeaways
- Install Prometheus and Grafana on your VPS, ensuring compatible versions and proper dependencies are met.
- Configure Prometheus alert rules with environment-specific thresholds to enable proactive monitoring.
- Connect Prometheus to Grafana, creating customized dashboards with relevant visualizations for comprehensive insights.
- Integrate alert notifications with channels like email or Slack for prompt incident response.
- Fine-tune dashboards and alerting rules for optimal performance, data clarity, and proactive system management.

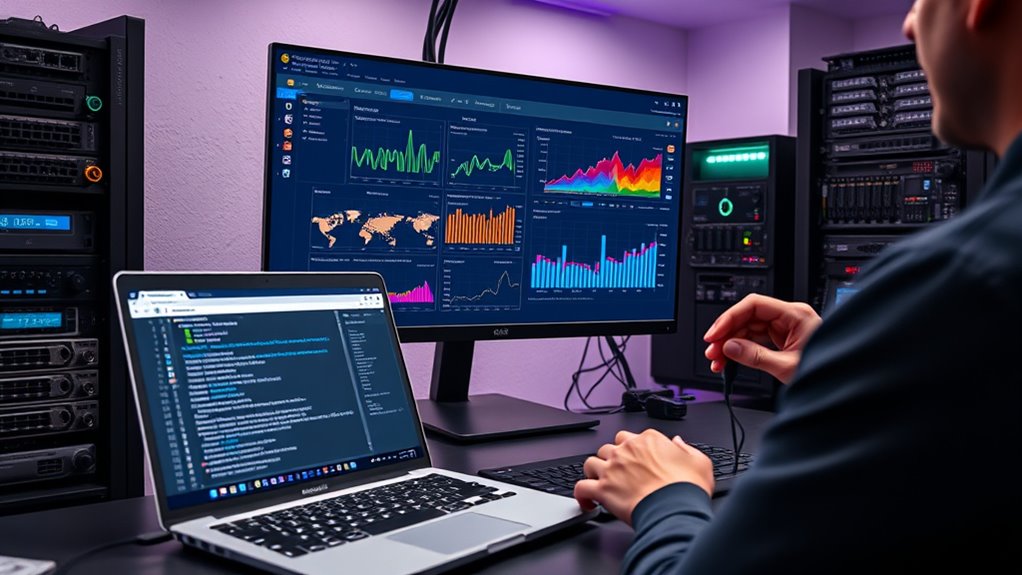
Setting up Prometheus and Grafana on your VPS is a powerful way to monitor your systems and visualize data in real-time. Once you have both tools installed, you’ll want to focus on configuring alerting and customizing your dashboards to get the most out of your monitoring setup. Alerting configuration allows you to set thresholds and notifications for specific metrics, ensuring you’re immediately informed of issues before they escalate. To do this effectively, you’ll need to define alert rules within Prometheus, specifying conditions under which alerts should trigger, like high CPU usage or low disk space. These rules help you stay proactive, minimizing downtime and performance bottlenecks. Simultaneously, you can integrate these alerts with notification channels such as email, Slack, or PagerDuty, so you’re always in the loop without constantly monitoring dashboards.
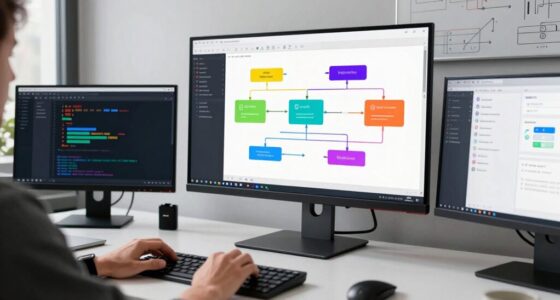
Dashboard customization is where Grafana truly shines. You can tailor dashboards to display the metrics that are most relevant to your environment, whether that’s server load, network traffic, or application performance. Start by creating panels that visualize individual metrics, then organize these panels into meaningful layouts that make sense for your workflow. Grafana offers a variety of visualization options—graphs, tables, heatmaps—that you can fine-tune with labels, thresholds, and color schemes to make critical data stand out. As you build out your dashboards, consider setting up templated variables for easier filtering and data exploration, so you can quickly switch between different servers or services without creating new panels each time. Additionally, exploring expert voice actors can provide insights into how to make your dashboards more engaging and intuitive for your users.
Moreover, Grafana’s dashboard customization isn’t just about aesthetics—it’s about making data actionable. You can add annotations, overlay multiple metrics, and set up alerts directly within dashboards to highlight anomalies or trends in real time. Combining this with Prometheus’s alerting configuration means you can design a detailed monitoring system that not only visualizes your data but actively warns you when something goes wrong. This synergy transforms your VPS monitoring from basic data collection to a proactive, intelligent system that helps maintain high availability and performance. By carefully setting up alerting rules and customizing dashboards, you ensure your monitoring environment is tailored precisely to your needs, giving you confidence that your infrastructure is under control at all times.

APRENDE NGINX: Domina Web Servers, Load Balancers e Integraciones en Entornos Modernos (Infraestructura y Automatización España) (Spanish Edition)
As an affiliate, we earn on qualifying purchases.
As an affiliate, we earn on qualifying purchases.
Frequently Asked Questions
How Do I Secure My Prometheus and Grafana Installations?
To secure your Prometheus and Grafana installations, you should implement access control measures like username and password authentication, and restrict network access to trusted IPs. Enable data encryption via TLS to protect data in transit. Regularly update your software, configure firewalls, and monitor logs for suspicious activity. These steps help keep your monitoring system secure from unauthorized access and data breaches.
Can I Integrate Prometheus With Other Monitoring Tools?
Imagine a world where your monitoring tools work seamlessly together—yes, you can integrate Prometheus with third-party tools. This opens the door to custom dashboards, giving you a complete view of your system’s health. Prometheus’s flexible data collection and export options make it easy to connect with other solutions, so you can tailor your monitoring environment and stay ahead, confident in your ability to adapt and grow.
What Are Best Practices for Scaling Prometheus on a VPS?
When scaling Prometheus on a VPS, focus on load balancing and data sharding to handle increased data volume. You should distribute scrape loads across multiple Prometheus instances and implement data sharding to split metrics storage. This approach prevents bottlenecks, improves reliability, and guarantees efficient data collection. Regularly monitor your setup’s performance, optimize resource allocation, and consider federation or remote storage solutions for long-term scalability.
How Do I Set up User Permissions in Grafana?
You set up user permissions in Grafana by defining user roles and permission levels. First, create users in Grafana and assign roles like Viewer, Editor, or Admin based on their access needs. These roles determine what dashboards or data they can view or modify. Use the Grafana UI or API to manage these roles, ensuring each user has appropriate permissions to maintain security and control over your monitoring environment.
Is It Possible to Automate Updates for Prometheus and Grafana?
You can definitely automate updates for Prometheus and Grafana by leveraging automated deployment tools like Ansible, Terraform, or Jenkins. These tools help manage version control, streamline deployment, and guarantee you’re always running the latest stable versions. By setting up scheduled jobs or CI/CD pipelines, you keep your monitoring stack current, reduce manual effort, and minimize downtime, creating a seamless workflow for version management and updates.

UPALDHOU Dash Air Conditioning Replacement Panel, Sturdy ABS Anti Scratch Dashboard AC Panel with Snap in Installation, for Dashboard AC Control under Center Console (AUTO)
[Elegant & Modern Design] Featuring a and contemporary design this dash ac replacement panel enhances your vehicle's interior…
As an affiliate, we earn on qualifying purchases.
As an affiliate, we earn on qualifying purchases.
Conclusion
Now that you’ve set up Prometheus and Grafana on your VPS, you’re just scratching the surface of what’s possible. With your monitoring tools in place, the real magic begins—tracking, analyzing, and optimizing your systems like never before. But beware, as your infrastructure grows, so do the challenges and insights waiting to be uncovered. Are you ready to dive deeper and access the full potential of your monitoring setup? The journey has just begun.

Smart DIY Security Cameras with ESP32-CAM: Build Motion-Activated Alert Systems, Email Notifications, and SD Card Video Logging (The ESP32-CAM Mastery Collection Book 2)
As an affiliate, we earn on qualifying purchases.
As an affiliate, we earn on qualifying purchases.

Autel MaxiTPMS ITS600Pro Upgrade of TS508WF ITS600 TPMS Programming Tool All System Diagnostics TPMS Relearn Tool Activate Read Autel Sensor
【2025 Autel ITS600 Pro TPMS Programming Tool】The Autel MaxiTPMS ITS600Pro is a versatile and advanced tool designed for…
As an affiliate, we earn on qualifying purchases.
As an affiliate, we earn on qualifying purchases.