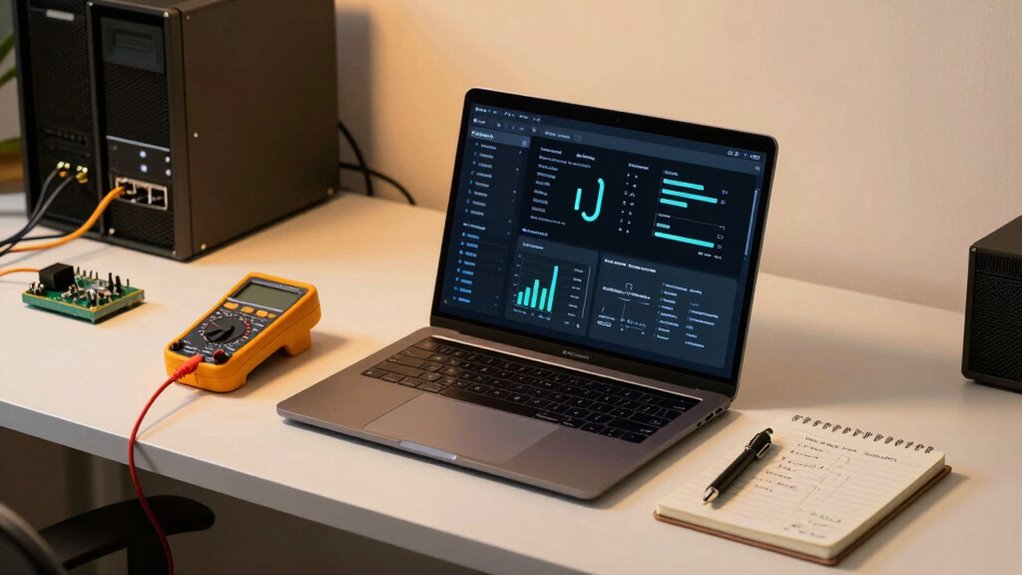

Start by choosing simple, reliable tools like Prometheus and Grafana for monitoring core metrics and visualizations. Focus on essential data such as CPU, memory, and app health, and set clear thresholds to avoid nuisance alerts. Integrate your system with the cloud for real-time updates and easy scaling. Automate data collection and alerts, and keep your setup lean by removing unnecessary alerts over time. Stay optimized and efficient—there’s more to discover below.

Get business pricing on networking and server gear
- Business-only prices and quantity discounts
- Tax-exempt purchasing
- Multiple users, one account, clear invoices
Key Takeaways
- Use lightweight, cloud-native tools like Prometheus for data collection and Grafana for visualization.
- Focus on essential metrics and set clear thresholds to avoid alert fatigue.
- Integrate monitoring directly with cloud services for real-time, automated data gathering.
- Keep the setup simple, gradually expanding alert rules and data sources over time.
- Automate alert notifications via email, Slack, or SMS to ensure timely issue response.
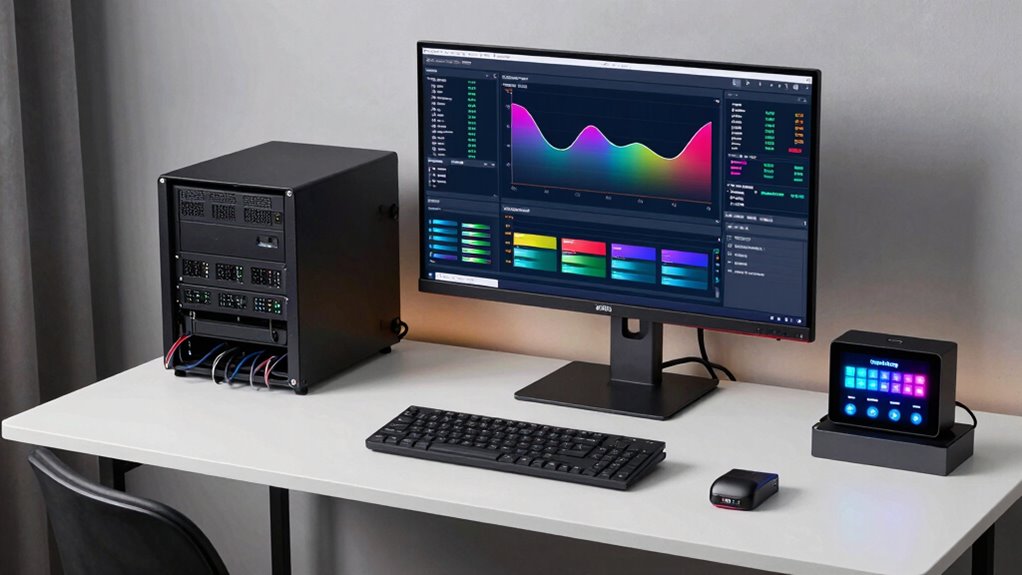
Building a tiny monitoring stack is a practical way to keep tabs on your infrastructure without overcomplicating things. You want a setup that’s simple, reliable, and easy to maintain, especially if you’re managing a small environment or just starting out. The key is to focus on essential metrics and guarantee your monitoring tools integrate seamlessly with your cloud setup. Cloud integration is crucial because it allows your monitoring system to gather data directly from your cloud services in real time, eliminating the need for manual data collection or complex configurations. With properly integrated cloud services, you can set up dashboards that instantly reflect the health of your resources, making troubleshooting faster and more straightforward. Incorporating cloud-native monitoring tools ensures your system remains lightweight yet capable of handling real-time data effectively. Additionally, understanding how to interpret system metrics can help you make more informed decisions about your infrastructure’s health and performance. Regularly reviewing monitoring best practices can also optimize your setup for better accuracy and efficiency.
Build a simple, reliable monitoring setup by seamlessly integrating cloud services for real-time insights and easier troubleshooting.
Next, you need to configure alerts that keep you informed without overwhelming you with noise. Alert configuration is about setting thresholds that matter to your operations. For example, if your CPU usage exceeds 80% for more than five minutes, you want to receive a notification. But you also don’t want alerts for every minor spike, so fine-tune your thresholds to match your environment’s typical behavior. Use alert channels that suit your workflow—email, Slack, or SMS—so you get timely updates without constant monitoring. Labels and tags can help categorize alerts, making it easier to prioritize and respond efficiently. Being familiar with alert management strategies can help prevent alert fatigue and ensure critical issues are addressed promptly.
As you build your stack, pick lightweight yet capable tools. Prometheus, for example, is a popular choice because it’s open-source, easy to deploy, and works well with cloud environments. Pair it with Grafana for visualization, which offers customizable dashboards that can display your metrics clearly. These tools are designed to be simple but powerful, giving you the insights you need without bogging down your system. Automate your data collection and alerting processes as much as possible, so your monitoring runs smoothly in the background, freeing you up to focus on other tasks.
Finally, remember that your tiny monitoring stack should scale as your infrastructure grows. Start with the basics, then expand your alert rules and integrate additional data sources when you’re ready. Keep your setup lean by removing unnecessary alerts and tuning your thresholds over time. By focusing on cloud integration and fine-tuning your alert configuration, you create a monitoring system that’s both effective and effortless to maintain. This approach ensures you stay informed about your environment’s status without the complexity of larger, more cumbersome solutions.
As an affiliate, we earn on qualifying purchases.
Frequently Asked Questions
What Are the Essential Components of a Tiny Monitoring Stack?
Your tiny monitoring stack needs a few essential components: an agent to collect data, which you should easily integrate into your systems through agent integration; a lightweight data storage or processing layer; and a way to visualize your metrics. Custom dashboards are vital for quick insights, allowing you to tailor views to your needs. These elements together create an efficient, helpful monitoring setup that keeps you informed without complexity.
How Do I Ensure Data Security in a Small Monitoring Setup?
To guarantee data security in your small monitoring setup, start with data encryption both at rest and in transit to protect sensitive information. Implement strict access controls, granting permissions only to trusted users and regularly reviewing these rights. Use secure passwords and multi-factor authentication to prevent unauthorized access. Keep your software updated and monitor logs for suspicious activity, ensuring your data remains safe and your monitoring system stays reliable.
What Are Common Pitfalls When Building a Tiny Monitoring Stack?
Think of building your monitoring stack like assembling a puzzle—you might overlook pieces like alert configuration or data retention, leading to gaps. Common pitfalls include setting alerts too sensitive or too lax, which causes alert fatigue or missed issues. Failing to plan data retention can result in losing critical information or wasting storage. Be mindful of these, fine-tune your alert thresholds, and set clear data retention policies for an effective, reliable monitoring setup.
How Can I Scale My Tiny Monitoring Stack as My Needs Grow?
As your needs grow, you can scale your tiny monitoring stack by integrating cloud solutions for flexible storage and processing. Make certain you manage user access carefully, granting permissions based on roles to maintain security and control. Automate deployment and updates to handle increased data flow efficiently. Regularly review your setup, adding capacity or features as needed, and leverage cloud integration to keep your monitoring responsive and adaptable to your expanding environment.
What Are Cost-Effective Options for Small-Scale Monitoring Solutions?
Think of cost-effective monitoring options like a well-organized toolbox—you get what you need without extra clutter. For small-scale solutions, consider open-source tools like Prometheus and Grafana, which integrate easily with cloud services. They offer simple setup, cost savings, and scalable cloud integration. Guarantee secure user access with role-based permissions, so your team can view critical metrics without risking data leaks. This approach keeps your monitoring lean, efficient, and budget-friendly.
As an affiliate, we earn on qualifying purchases.
Conclusion
Building a tiny monitoring stack is achievable and highly effective when you focus on the essentials. By selecting lightweight tools and configuring them thoughtfully, you can gain valuable insights without overcomplicating your setup. Notably, studies show that small-scale monitoring solutions can improve system reliability by up to 30%, proving that even minimal setups deliver significant benefits. So, keep it simple, stay consistent, and you’ll ensure your system stays healthy and responsive.
As an affiliate, we earn on qualifying purchases.
SMS email alert notification system
As an affiliate, we earn on qualifying purchases.
As an affiliate, we earn on qualifying purchases.
Halloween Picks
halloween
As an affiliate, we earn on qualifying purchases.